In SAPPAN, we have developed several models for detecting anomalous events in endpoints. For example, we have built a model for identifying anomalous process launch events and a model for identifying anomalous “module load” operations. In order to increase the reliability of detections reported by the models and to support security analysts in handling those detections, we have experimented with combining detected anomalies in so-called provenance graphs. Our hypothesis here is that cyberattacks often result in multiple anomalies involving the same endpoint entities. This blog post presents our initial approach.
Introduction
When developing cyber-attack detection and response mechanisms, finding appropriate trade-offs between often contradictory precision and sensitivity requirements is a serious challenge for two main reasons: (1) exaggerated sensitivity demands lead to an information overload which can cause security analysts to miss attacker activities due to overwhelming noise created by false positives, and (2) exaggerated precision demands, on the other hand, cause the incoming stream of potentially relevant signals to be narrowed down and result in attacker operation detections going unnoticed until it is too late. One way to solve this problem is to develop auxiliary approaches and tools that illustrate how a computer system flagged as “potentially under attack” came to be in that state.
Traditionally, approaches for detecting malware and cyber-attacks are divided into two groups: misuse detection and anomaly detection. Well known examples from the former group rely on descriptions of static and dynamic patterns of attacks that are encapsulated in detection rules written by experts. The latter encompasses various approaches to determining uncommon states and behaviours that include heuristics, statistical methods, machine learning techniques, and so forth.
In SAPPAN, we have developed a set of models designed to detect specific classes of anomalous endpoint behaviour and a method for presenting connections among detected anomalies as a node-edge graph. In this article, we illustrate how our proposed methodology – a combination of elements of state provenance and statistical anomaly detection – can be used to help analysts, threat hunters and incident investigators in their day-to-day activities.
Our approach
A standalone computer system can be thought of as a set of computer programs (further referred to as processes) communicating with each other and the host (endpoint) operating system via various API calls and messaging protocols. Supporting entities and concepts include but are not limited to process address space, synchronization objects, file system, system registry, and network communication primitives. Another important notion – events – captures how processes interact with entities. Event Tracing on Windows and Audit frameworks on Linux can be used to obtain information about the rationales and structures of such events (we are naturally interested in cyber security-relevant ones).
Every distinct event type can be represented in a compact form that includes its subject (used to describe an active process), object (description of an entity the subject interacts with) and attributes of the interaction. We treat each event type separately and design and train dedicated statistical anomaly detection models to categorize events with respect to their anomalousness. Trained anomaly detection models then assess incoming endpoint events in real-time and assign anomalousness categories to those events. In this setting, we assume that events that are valuable from a cyber security perspective possess a certain degree of anomalousness, and we, therefore, treat such events as informative for security analysts. Events identified as common (or normal) are not considered in the scope of this approach and should be handled by other mechanisms.
Our approach firstly collects and identifies anomalous events. Next, a graph is constructed where edges represent anomalous events and nodes represent the subjects and objects of those events.

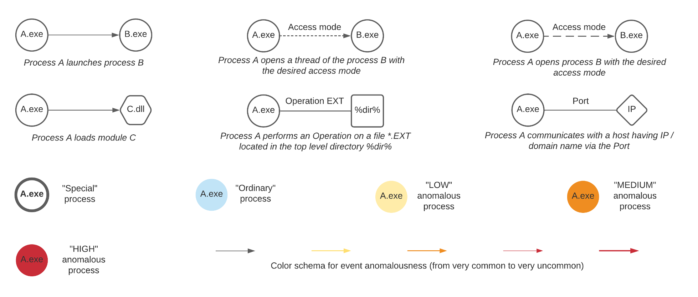
Figure 1 illustrates our adopted notation and presents examples of nodes and edges between processes, shared libraries, file system locations, hosts, registry keys, and so on. Let us consider, for example, a new process creation event type. Both subject and object entities are processes depicted by circles and labeled with the executable image file names. The direction of the edge arrow denotes a parent (subject) to child (object) process relationship. Node and edge colors represent anomalousness. A circle with a solid border represents a process that was found to be involved in suspicious activities by misuse detection logic mechanisms (typically based on rules).

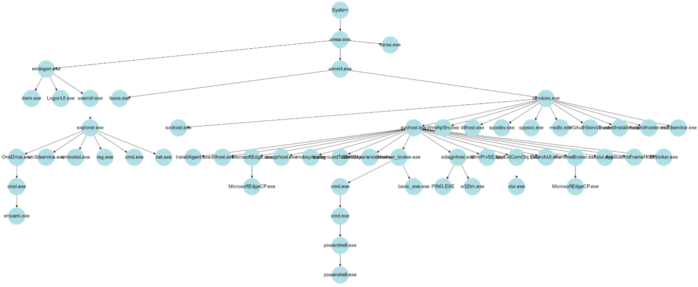
An example of a simple provenance graph is given in Figure 2. In order to collect a node’s state provenance, that node’s path is traced back through the graph to the root node (“System” process in Figure 2). Braun et al. in the paper “Securing Provenance” (2008) define provenance as follows:
“Provenance describes how an object came to be in its present state. Provenance is a causality graph with annotations. The causality graph connects the various participating objects describing the process that produced an object’s present state. Each node represents an object, and each edge represents a relationship between two objects. This graph is an immutable directed acyclic graph.”
For the sake of simplicity, the graph in Figure 2 is trimmed (some processes irrelevant to our example have been removed). The illustrated structure highlights the existence of key system and user processes found at the right and left sides of the graph.
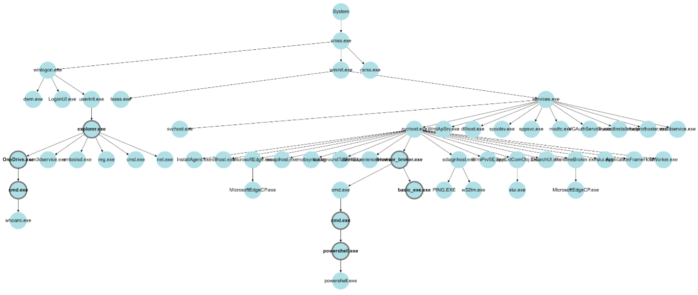
Readers skilled in cyber security matters will notice that the above example represents activities associated with a type of cyber-attack. Misuse detection techniques can be used to identify processes that are commonly involved in cyber-attacks. In the example presented in Figure 2, applying detection of suspicious command line parameters, memory scanning, static and dynamic analysis of executables and processes, and other common misuse detection techniques enable us to highlight suspicious processes with bold borders, and thus derive the graph depicted in Figure 3.

The process chains depicted in Figure 3 that include highlighted suspicious processes allow us to understand the origins of and the actions performed during the attack.
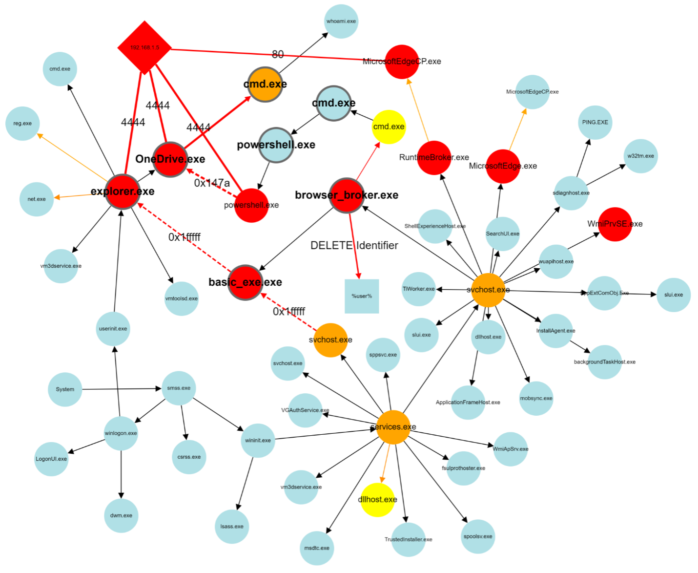
Since rare activities cause rare side effects (that can also be considered rare events), and attack activities are typically rare, we expect attacks to leave “ripples” (i.e., uncommon events that may seem irrelevant) in the log traces of computer systems. Given this fact, we can augment process chains with information regarding statistically uncommon (anomalous) events in order to improve our ability to detect attacks. Some of the edges in a process tree can point to these uncommon events. For instance, in the example depicted in Figure 3, the console applications net.exe and reg.exe usually work in the context of command line interpreters like cmd.exe and powershell.exe. In the illustrated process tree, however, we see that they were instead called directly by the program manager process – explorer.exe. Although it is wrong to assume that such explorer.exe behaviour is reliably indicative of an attack, it is useful to highlight such an observation to security analysts, especially in uncertain cases.
A number of event types exist that can be utilized to augment a process tree. These provide a backbone for defining connections between the main subjects (processes) of interesting events that can occur on a computer system. Figure 4 illustrates how uncommon new process, open process, network connection, and file access events “group together” in the process trees shown in the previous Figures. Note that the provided illustration does not completely conform to the provenance graph requirement that these graphs be directed and acyclic.

A security analyst can quickly and easily read a graph such as the one presented in Figure 4 to understand how a computer system came to its present (suspicious) state and thus understand whether an attack is ongoing, and if so, identify affected processes and entities. Colored edges in the illustration point to anomalous events, and colored circles represent entities (processes, IP addresses) observed in anomalous contexts. This graph representation provides security analysts with rich context, enabling faster decision making and supporting in response actions planning. It has often been noted that a picture is worth a thousand words. For security analysts facing increasing alert fatigue, these pictures may be worth a whole lot more.
About the authors:
Dmitriy Komashinskiy is Lead Researcher at WithSecure Tactical Defense unit and focuses currently on the core analytics functionality of WithSecure’s attack detection and response services. Before joining WithSecure, Dmitriy worked in several companies in the information security area as well as at the Computer Security Laboratory of Saint-Petersburg Institute for Informatics and Automation, from where he received PhD degree in Information Security. He authored a number of papers and patents in the cybersecurity domain.
Andrew Patel is an artificial intelligence researcher at WithSecure. His areas of specialty include social network and disinformation analysis, graph analysis and visualization methods, reinforcement learning, natural language processing, and artificial life. Andrew is a key contributor to the AI section of the WithSecure blog.