News

4th International Workshop on Next Generation Security Operations Centers (NG-SOC 2022)

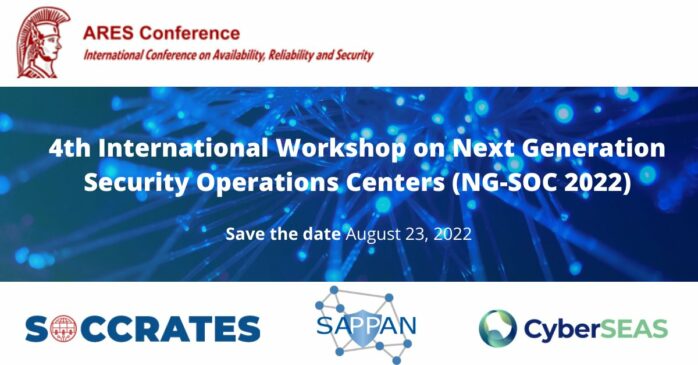
We are proud to announce the 4th International Workshop on Next Generation Security Operations Centers (NG-SOC 2022) to be held in conjunction with the 17th International Conference on Availability, Reliability and Security (ARES 2022 – http://www.ares-conference.eu) on August 23, 2022.


This year, the workshop is jointly organized by three projects that are funded by the European Commission: SOCCRATES, SAPPAN, and CyberSEAS.


Overview:

Organizations in Europe face the difficult task of detecting and responding to increasing numbers of cyber-attacks and threats, given that their own ICT infrastructures are complex, constantly changing (e.g. by the introduction of new technologies) and there is a shortage of qualified cybersecurity experts. There is a great need to drastically reduce the time to detect and respond to cyber-attacks. A key means for organizations to stay ahead of the threat is through the establishment of a Security Operations Center (SOC). The primary purpose of a SOC is to monitor, assess and defend the information assets of an enterprise, both on a technical and organizational level.

The aim of this workshop is to create a forum for researchers and practitioners to discuss the challenges associated with SOC operations and focus on research contributions that can be applied to address these challenges. Through cooperation among European projects, the workshop intends to provide a more comprehensive overview of the promising research-based solutions that enable timely response to emerging threats and support different aspects of the security analysis and recovery process.


DESCRIPTION OF THE PROJECTS


SOCCRATES will develop and implement a new security platform for Security Operation Centres (SOCs) and Computer Security Incident Response Teams (CSIRTs), that will significantly improve an organisation’s capability to quickly and effectively detect and respond to new cyber threats and ongoing attacks. The SOCCRATES Platform consists of an orchestrating function and a set of innovative components for automated infrastructure modelling, attack detection, cyber threat intelligence utilization, threat trend prediction, and automated analysis using attack defence graphs and business impact modelling to aid human analysis and decision making on response actions and enable the execution of defensive actions at machine-speed. The SOCCRATES Platform aims to enable organisations to improve the resilience of their infrastructures and increase productivity and efficiency at the SOC. The outcomes of the project will contribute to a more secure cyberspace and strengthen competitiveness in the EU digital single market.

More information: https://www.soccrates.eu/


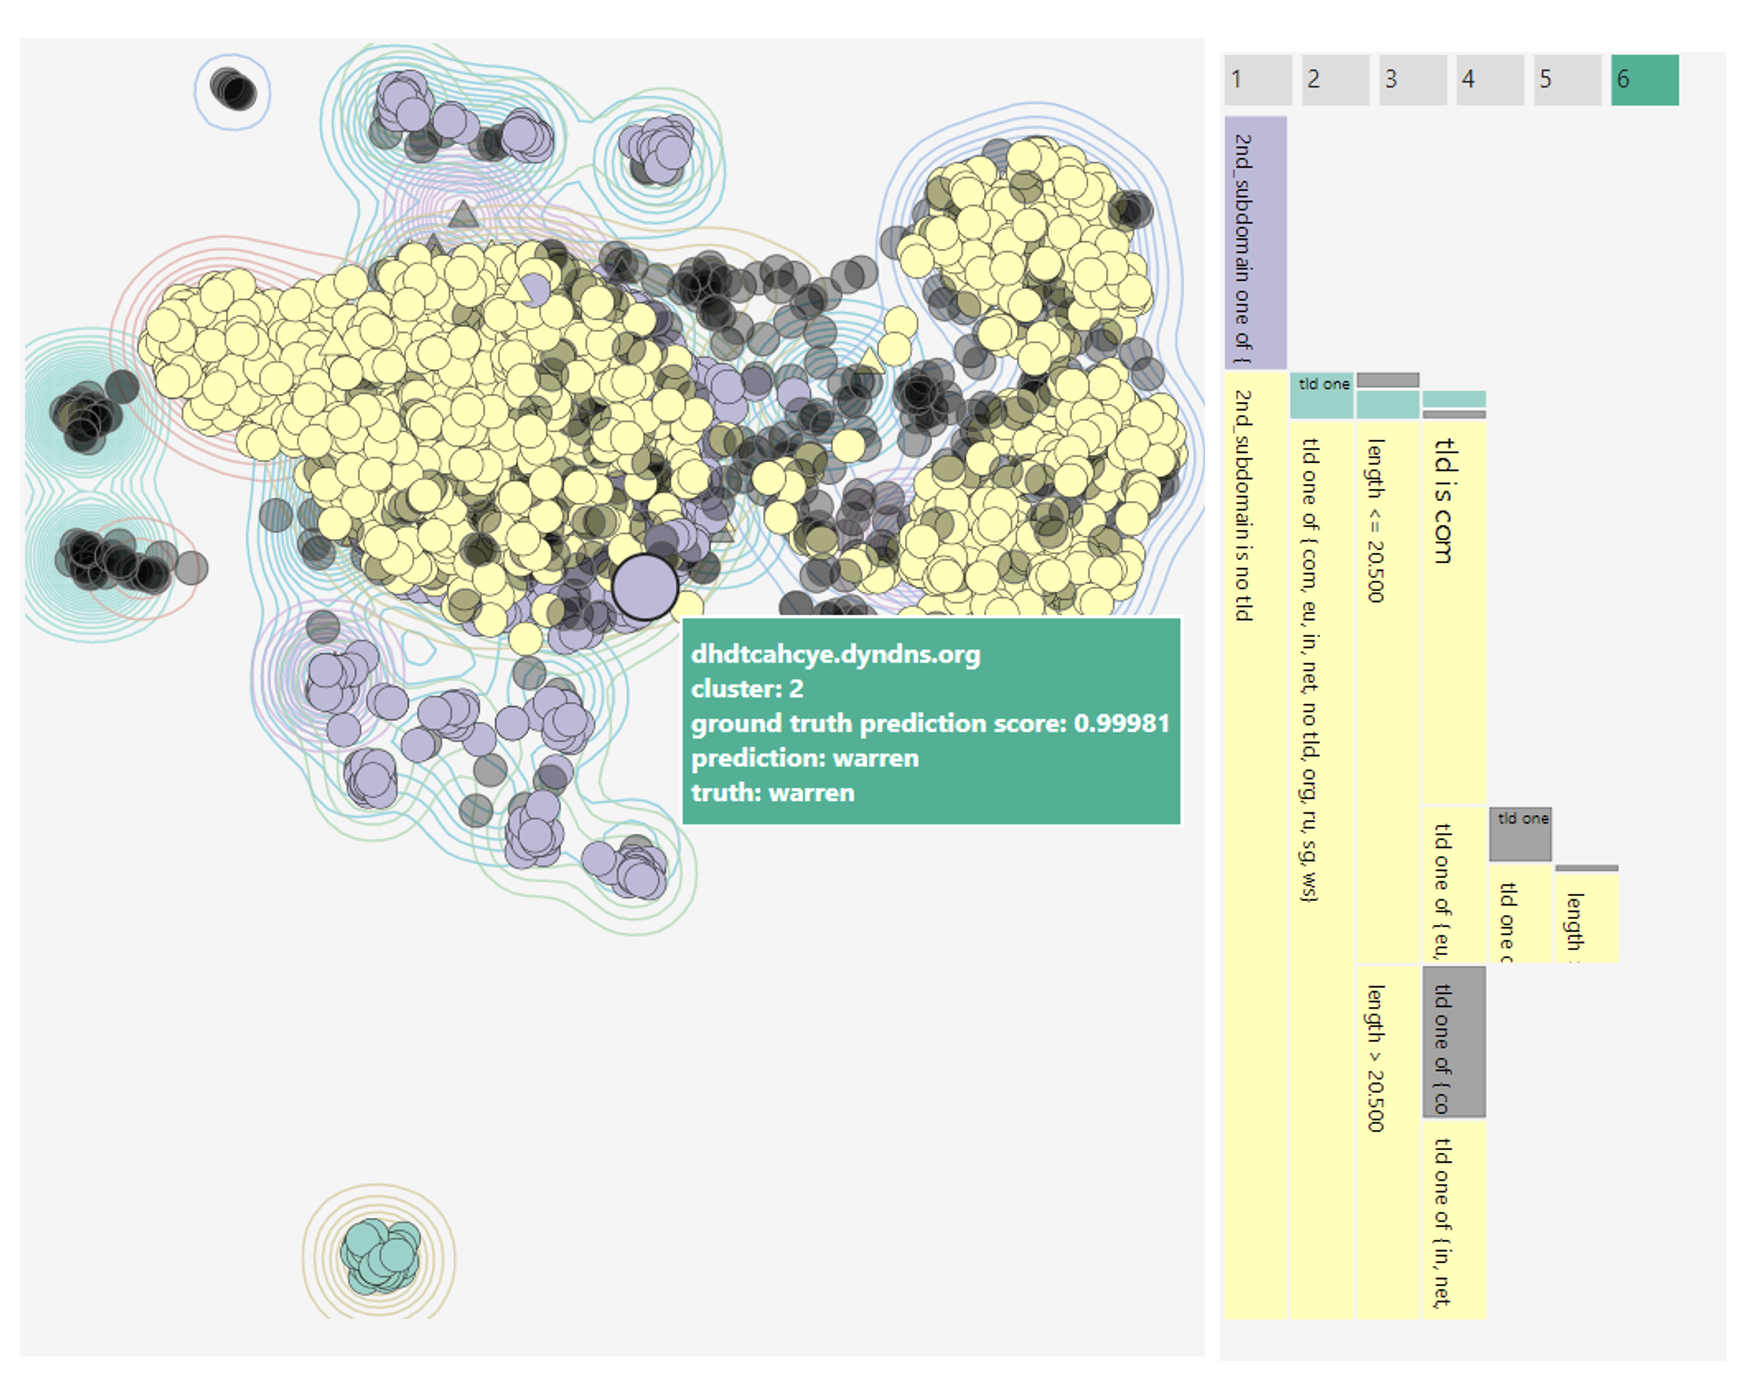
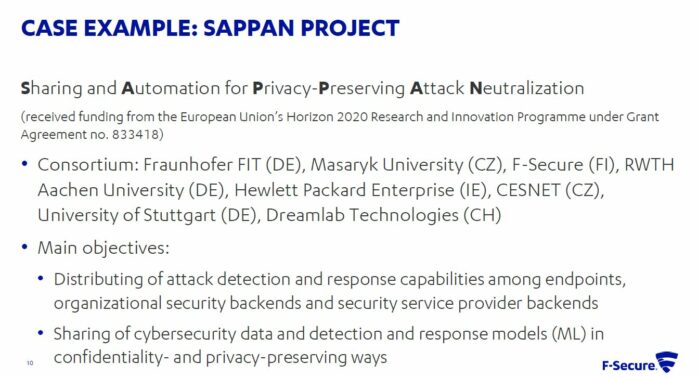
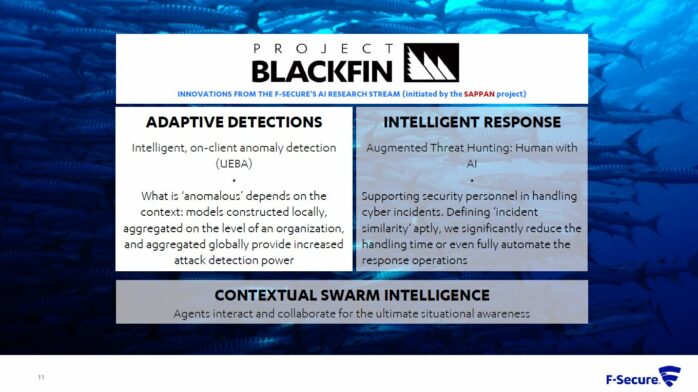
SAPPAN project aims to enable efficient protection of modern ICT infrastructures via advanced data acquisition, threat analysis, and privacy-aware sharing and distribution of threat intelligence aimed to dynamically support human operators in response and recovery actions. The SAPPAN project will develop a collaborative, federated, and scalable attack detection to support response activities and allow for timely responses to newly emerging threats supporting different privacy-levels. We plan to identify a standard for the interoperable and machine-readable description of incident response reports and recovery solutions. The risk assessment, privacy, and security will be addressed in the standard design. Results of both attack detection and recovery and response processes will be shared on a global level to achieve an advanced response and recovery via knowledge sharing and federated learning. We develop a mechanism for sharing information on threat intelligence, which implements a combination of encryption and anonymization to achieve GDPR compliance. Novel visualization techniques will be developed to assist security and IT personnel and provide an enhanced content of context of the response and recovery and improved visual presentation of the process.

More information: https://sappan-project.eu/


CyberSEAS (Cyber Securing Energy dAta Services) project aims to improve the resilience of energy supply chains, protecting them from disruptions that exploit the enhanced interactions and extended involvement models of stakeholders and consumers in complex attack scenarios, characterised by the presence of legacy systems and the increasing connectivity of data feeds. The project has three strategic objectives: 1) countering the cyber risks related to highest impact attacks against EPES; 2) protecting consumers against personal data breaches and attacks; and 3) increasing the security of the Energy Common Data Space. CyberSEAS will deliver an extendable ecosystem of many customisable security solutions providing effective support for key activities, and in particular: risk assessment; interaction with end devices; secure development and deployment; real-time security monitoring; skills improvement and awareness; certification, governance and cooperation.

More information: https://cyberseas.eu/


For more information about the event, please check: https://www.ares-conference.eu/workshops-eu-symposium/ng-soc-2022/

For security analysts, a picture may be worth more than a thousand words

Dmitriy Komashinskiy and Andrew Patel (WithSecure)
In SAPPAN, we have developed several models for detecting anomalous events in endpoints. For example, we have built a model for identifying anomalous process launch events and a model for identifying anomalous “module load” operations. In order to increase the reliability of detections reported by the models and to support security analysts in handling those detections, we have experimented with combining detected anomalies in so-called provenance graphs. Our hypothesis here is that cyberattacks often result in multiple anomalies involving the same endpoint entities. This blog post presents our initial approach.


Introduction

When developing cyber-attack detection and response mechanisms, finding appropriate trade-offs between often contradictory precision and sensitivity requirements is a serious challenge for two main reasons: (1) exaggerated sensitivity demands lead to an information overload which can cause security analysts to miss attacker activities due to overwhelming noise created by false positives, and (2) exaggerated precision demands, on the other hand, cause the incoming stream of potentially relevant signals to be narrowed down and result in attacker operation detections going unnoticed until it is too late. One way to solve this problem is to develop auxiliary approaches and tools that illustrate how a computer system flagged as “potentially under attack” came to be in that state.

Traditionally, approaches for detecting malware and cyber-attacks are divided into two groups: misuse detection and anomaly detection. Well known examples from the former group rely on descriptions of static and dynamic patterns of attacks that are encapsulated in detection rules written by experts. The latter encompasses various approaches to determining uncommon states and behaviours that include heuristics, statistical methods, machine learning techniques, and so forth.

In SAPPAN, we have developed a set of models designed to detect specific classes of anomalous endpoint behaviour and a method for presenting connections among detected anomalies as a node-edge graph. In this article, we illustrate how our proposed methodology – a combination of elements of state provenance and statistical anomaly detection – can be used to help analysts, threat hunters and incident investigators in their day-to-day activities.

Our approach

A standalone computer system can be thought of as a set of computer programs (further referred to as processes) communicating with each other and the host (endpoint) operating system via various API calls and messaging protocols. Supporting entities and concepts include but are not limited to process address space, synchronization objects, file system, system registry, and network communication primitives. Another important notion – events – captures how processes interact with entities. Event Tracing on Windows and Audit frameworks on Linux can be used to obtain information about the rationales and structures of such events (we are naturally interested in cyber security-relevant ones).

Every distinct event type can be represented in a compact form that includes its subject (used to describe an active process), object (description of an entity the subject interacts with) and attributes of the interaction. We treat each event type separately and design and train dedicated statistical anomaly detection models to categorize events with respect to their anomalousness. Trained anomaly detection models then assess incoming endpoint events in real-time and assign anomalousness categories to those events. In this setting, we assume that events that are valuable from a cyber security perspective possess a certain degree of anomalousness, and we, therefore, treat such events as informative for security analysts. Events identified as common (or normal) are not considered in the scope of this approach and should be handled by other mechanisms.

Our approach firstly collects and identifies anomalous events. Next, a graph is constructed where edges represent anomalous events and nodes represent the subjects and objects of those events.

Figure 1: Examples of node-edge relationships adopted by our methodology

Figure 1 illustrates our adopted notation and presents examples of nodes and edges between processes, shared libraries, file system locations, hosts, registry keys, and so on. Let us consider, for example, a new process creation event type. Both subject and object entities are processes depicted by circles and labeled with the executable image file names. The direction of the edge arrow denotes a parent (subject) to child (object) process relationship. Node and edge colors represent anomalousness. A circle with a solid border represents a process that was found to be involved in suspicious activities by misuse detection logic mechanisms (typically based on rules).

Figure 2: An example provenance graph created from a process tree on an endpoint running Microsoft Windows

An example of a simple provenance graph is given in Figure 2. In order to collect a node’s state provenance, that node’s path is traced back through the graph to the root node (“System” process in Figure 2). Braun et al. in the paper “Securing Provenance” (2008) define provenance as follows:

“Provenance describes how an object came to be in its present state. Provenance is a causality graph with annotations. The causality graph connects the various participating objects describing the process that produced an object’s present state. Each node represents an object, and each edge represents a relationship between two objects. This graph is an immutable directed acyclic graph.”

For the sake of simplicity, the graph in Figure 2 is trimmed (some processes irrelevant to our example have been removed). The illustrated structure highlights the existence of key system and user processes found at the right and left sides of the graph.

Readers skilled in cyber security matters will notice that the above example represents activities associated with a type of cyber-attack. Misuse detection techniques can be used to identify processes that are commonly involved in cyber-attacks. In the example presented in Figure 2, applying detection of suspicious command line parameters, memory scanning, static and dynamic analysis of executables and processes, and other common misuse detection techniques enable us to highlight suspicious processes with bold borders, and thus derive the graph depicted in Figure 3.

Figure 3: Suspicious processes (as determined by misuse detection methods) highlighted with a bold border.

The process chains depicted in Figure 3 that include highlighted suspicious processes allow us to understand the origins of and the actions performed during the attack.

Since rare activities cause rare side effects (that can also be considered rare events), and attack activities are typically rare, we expect attacks to leave “ripples” (i.e., uncommon events that may seem irrelevant) in the log traces of computer systems. Given this fact, we can augment process chains with information regarding statistically uncommon (anomalous) events in order to improve our ability to detect attacks. Some of the edges in a process tree can point to these uncommon events. For instance, in the example depicted in Figure 3, the console applications net.exe and reg.exe usually work in the context of command line interpreters like cmd.exe and powershell.exe. In the illustrated process tree, however, we see that they were instead called directly by the program manager process – explorer.exe. Although it is wrong to assume that such explorer.exe behaviour is reliably indicative of an attack, it is useful to highlight such an observation to security analysts, especially in uncertain cases.

A number of event types exist that can be utilized to augment a process tree. These provide a backbone for defining connections between the main subjects (processes) of interesting events that can occur on a computer system. Figure 4 illustrates how uncommon new process, open process, network connection, and file access events “group together” in the process trees shown in the previous Figures. Note that the provided illustration does not completely conform to the provenance graph requirement that these graphs be directed and acyclic.

Figure 4: The color-coded provenance graph presented to security analysts

A security analyst can quickly and easily read a graph such as the one presented in Figure 4 to understand how a computer system came to its present (suspicious) state and thus understand whether an attack is ongoing, and if so, identify affected processes and entities. Colored edges in the illustration point to anomalous events, and colored circles represent entities (processes, IP addresses) observed in anomalous contexts. This graph representation provides security analysts with rich context, enabling faster decision making and supporting in response actions planning. It has often been noted that a picture is worth a thousand words. For security analysts facing increasing alert fatigue, these pictures may be worth a whole lot more.

About the authors:

Dmitriy Komashinskiy is Lead Researcher at WithSecure Tactical Defense unit and focuses currently on the core analytics functionality of WithSecure’s attack detection and response services. Before joining WithSecure, Dmitriy worked in several companies in the information security area as well as at the Computer Security Laboratory of Saint-Petersburg Institute for Informatics and Automation, from where he received PhD degree in Information Security. He authored a number of papers and patents in the cybersecurity domain.


Andrew Patel is an artificial intelligence researcher at WithSecure. His areas of specialty include social network and disinformation analysis, graph analysis and visualization methods, reinforcement learning, natural language processing, and artificial life. Andrew is a key contributor to the AI section of the WithSecure blog.


Modeling Host Behavior in Computer Network

By Tomas Jirsik (Institute of Computer Science, Masaryk University)

An analysis of a host behavior is an essential key for modern network management and security. A robust behavior profile enables the network managers to detect anomalies with high accuracy, predict the host behavior, or group host to clusters for better management. This blog introduces basic features for host behavior that can be obtained from network traffic and provides initial insights into long-term host behavior gained by analysis of host behavior over one year.

Network traffic monitoring is a rich source of information on host behavior. The passive large-scale approaches to traffic monitoring, such as network flow monitoring [1], enable us to observe a behavior of a large number of hosts in a network without the necessity to have direct access to these hosts. Current network monitoring approaches can provide information on each connection, even in high-speed networks, without any sampling.  

The data retrieved by network monitoring tools from network traffic represents individual connections (either one- or bi-directional). However, these network connections need to be transformed into features properly embedding the hosts behavior. Table 1 presents the basic features that can be extracted from the network connection records provided by a majority of the network monitoring tools.  

Table 1: Features for modeling host behavior

The models of host behavior can capture various aspects of host behavior. A commonly modeled behavior element includes temporal characteristics of the behavior, volumetric nature of the behavior, and last but not least, the usual habits of a user such as frequently visited domains, AS, or countries. More advanced analyses of the host behavior can focus on the identification of the stability of the host behavior, anomaly detection, behavior change detection, or host clustering.

Figure 1: Analysis of the temporal patterns of host behaviors.

Figure 1 provides an example of the analysis of active communication times for hosts in different types of subnets in a network over a year. A line in the figure represents a share of a single host’s active observations in a year. The diurnal pattern with the peak at noon and a smaller peak at 3 AM are present in the segment containing mainly work stations of regular workers (SUB_WORK). The peak culminating at noon represents the typical daylight activity. The smaller peak at 3 AM is caused by the updates of the workstations planned by the central management system. Similarly, the weekday pattern is observable at the SUB_WORK, which reflects the fact that the majority of the hosts in the SUB_WORK subnets are used by the employees of the university. Hosts in the server segment (SUB_SERV), on the other hand, do not show any significant diurnal pattern. 

Modeling the stability of the host behavior aims to identify hosts with unstable (i.e., irregular, more random) and differentiate them from the hosts that behave consistently in time. We can then work with the assumption that the hosts with consistent behavior in time usually pose a lower risk and do not be monitored in greater detail compared to the hosts with inconsistent behavior. The figures below present selected use-cases that can be identified using the host behavior models derived from their network behavior.

Figure 2: Model based on # of Flows can identify behavior change in traffic volume of a host, (a) behavior of a host over a year, (b) modeled week profiles of the host.
Figure 3: Model based on # of Flows can identify behavior change in active times. From January to March, the host communicates only in working hours, while from May, the hosts start communicating 24/7.
Figure 4: A suspicious behavior of a host indicating outgoing horizontal scanning in one week in a year (multiple connections on multiple hosts without the increase in a number of different ports contacted).

CONCLUSION

The examples shown in the blog provide only a glimpse of the possibilities of modeling the host behavior based on the data captured from network traffic. The host behavior modeling can be efficiently applied in various areas of network management, such as network segmentation, network policies settings, or even cybersecurity incident prioritization. All examples presented in the blog are explained and described in detail in [2], along with an open-source dataset of one-year host behavior data available on a public repository.

References:

[1]: R. Hofstede et al., “Flow Monitoring Explained: From Packet Capture to Data Analysis With NetFlow and IPFIX,” in IEEE Communications Surveys & Tutorials, vol. 16, no. 4, pp. 2037-2064, Fourthquarter 2014, doi: 10.1109/COMST.2014.2321898. 

 
[2]: T. Jirsik and P. Velan, “Host Behavior in Computer Network: One-Year Study,” in IEEE Transactions on Network and Service Management, vol. 18, no. 1, pp. 822-838, March 2021, doi: 10.1109/TNSM.2020.3036528. 

About the author(s):

Tomas Jirsik received the Ph.D. degree in informatics from the Faculty of Informatics, Masaryk University, Czech Republic. He is currently a Senior Researcher with the Institute of Computer Science, Masaryk University and a Member of the Computer Security Incident Response Team, Masaryk University, where he leads national and international research projects on cybersecurity. His research focus lies on the network traffic analysis with a specialization in host profiling. His research further includes network segmentation approaches via machine learning and host fingerprinting in network traffic. 


F-Secure becomes WithSecure

One of the SAPPAN consortium members, F-Secure decided to perform a de-merger and split into two companies. F-Secure confirmed the process of rebranding on the 22nd of March 2022. From that time, the corporate security business of F-Secure has relaunched as a new brand that shares the company’s new name WithSecure™.


This was a business decision to optimize customer relationships, improve focus and be more transparent with respect to the performance promise [2].


Thus, as we were a partner with F-Secure business, we exchanged F-Secure logos and information with WithSecure ones and are now official partners with WithSecure.


Final SAPPAN event

 SAPPAN is a Horizon 2020 project funded by the European Commission to enable efficient protection of modern ICT infrastructures via advanced data acquisition, threat analysis, visualisation, and privacy-aware sharing and distribution of threat intelligence aimed to dynamically support human operators in incident management. We are also very happy to introduce our keynote speaker Mikko Hyppönen (https://mikko.com/), who will give a talk on “STATE OF THE NET”, followed by presentations about selected key results of SAPPAN. 

The event will take place virtually (Zoom) on Monday 4.04.2022, 14:00 – 16:30 (CEST). We are looking forward to your participation.

Event Agenda

Time 

Subject

Speaker 

14:00-14:05 

Welcome

Fraunhofer FIT

14:05-14:35

Keynote: State of the NET

Mikko Hyppönen (F-Secure) 

14:35- 15:00

Sharing New Type of Threat Intelligence and SAPPAN Standardisation
Efforts

Martin Zadnik (CESNET) 

15:00-15:25

SAPPAN Innovations in DGA Detection

Arthur Drichel (RWTH University),

 Hugo Hromic (HPE Ireland)

15:25-15:35

Coffee Break

15:35 – 16:00

Response Recommendation and Automation

David Karpuk (F-Secure),

Martin Laštovička (Masaryk University), Mischa Obrecht (Dreamlab
Technologies)

16:00 – 16:25

Opportunities for Visualisation Support in CyberSecurity

Robert Rapp, Franziska Becker (University of Stuttgart)

16:25- 16:30

Wrap Up

Meeting Details

Meeting
link:
 https://cesnet.zoom.us/j/98176996869

Topic: Final SAPPAN event
Time: Apr 4, 2022 02:00 PM Prague Bratislava

Join Zoom Meeting
https://cesnet.zoom.us/j/98176996869

Meeting ID: 981 7699 6869
One tap mobile
+420228882388,,98176996869# Czech Republic
+420239018272,,98176996869# Czech Republic

Dial by your location
        +420 2 2888 2388 Czech Republic
        +420 2 3901 8272 Czech Republic
        +420 5 3889 0161 Czech Republic
Meeting ID: 981 7699 6869
Find your local number:
https://cesnet.zoom.us/u/adGtIUSKZF

Kenote speaker:

Mikko Hypponen is a global security expert. He has worked at F-Secure since 1991.
Mr. Hypponen has written on his research for the New York Times, Wired and Scientific American and he appears frequently on international TV. He has lectured at the universities of Stanford, Oxford and Cambridge.
He was selected among the 50 most important people on the web by the PC World magazine and was included in the FP Global 100 Thinkers list.
Mr. Hypponen sits in the advisory boards of t2 and Social Safeguard.

Technical speakers:

Franziska studied cognitive science and computer science at the
University of Osnabrück before joining the visualization institute (VIS) at the
University of Stuttgart as a PhD. Her main research topics include
visualization for explainable artificial intelligence as well as sensemaking
and decision making with visualization.

Arthur Drichel received the B.Sc. and M.Sc. degrees in Computer
Science from RWTH Aachen University.
He is a researcher at the Research Group IT-Security at RWTH Aachen University.
His research interests lie primarily in the areas of intrusion detection
systems, machine learning, and privacy enhancing technologies.

Martin Laštovička obtained his Ph.D. in Informatics at the Faculty of Informatics, Masaryk University, Czech Republic, and currently works as the head of the cybersecurity operations group in CSIRT-MU. His research topic lies in network traffic analysis and practical applications of machine learning to build Cyber Situational Awareness through the identification of network entities and their relationships. His focus is to apply research outputs to real-world data and enhance operations of the CSIRT-MU team.
Robert Rapp is a PhD Student at the Visualisation and Interactive Systems Institute (VIS) at the University of Stuttgart.  
After graduating with a degree in business informatics, he started his research in visual cyber analytics. As part of the Horizon 2020 project EU: SAPPAN his current work focuses on visual analysis of endpoint sensor data and analytical provenance in web interfaces.
Martin Zadnik is a deputy leader at the department of tools for network security  and administration at CESNET a.l.e. He has been a project leader in many national and contributor to many European projects related to network security, cyber threat intelligence, and network monitoring at high speeds. He cooperates with both public and commercial sectors in research and innovation of network cybersecurity concepts and their implementation into open-source tools or products.
Dr. David Karpuk is Senior Data Scientist at F-Secure, focusing on applications of machine learning and artificial intelligence to the construction of algorithms for cyberattack detection and response systems. He received his Ph.D. in Mathematics from the University of Maryland, College Park in 2012, and was previously a Postdoctoral Researcher at Aalto University in the Algebra, Number Theory, and Applications research group in the Department of Mathematics and Systems Analysis. After his postdoctoral work, he subsequently served as Assistant Professor in the Department of Mathematics at Universidad de los Andes, Colombia.  David was previously the recipient of an Academy of Finland Postdoctoral Researcher grant, as well as a Postdoctoral Researcher grant from the Magnus Ehrnrooth Foundation.

Additional materials:

You can download a flyer to this event here.
Futhermore, here you can download the calendar event with the invitation link.

Analytic provenance for security operation centres

Robert Rapp (University of Stuttgart)

An important part of incident response is still an analytical process to understand the cause of an incident and select response actions. Using therefore visualisations in security operation centres (SOC) can improve the alert triage of analysts by visual analytics to handle tons of alerts each day. Such an analysis requires a good understanding of cyber attacks and experiences to detect suspicious patterns in visualisations. However, this analytical process happens in the mind of analysts and cannot easily be transferred to others. Understanding the reasons for user insights and their manner is most relevant and challenging for analytical provenance.

In SAPPAN we have researched on analytical provenance in visualisations to make such an analysis comprehensible. Similar to data provenance that captures the traceability information about where data comes from and how the data was manipulated over time, we capture information about the visualised data and interactions applied in visualisations. To expand the SOC analysts’ opportunities within the SAPPAN dashboard, we created a tool to record interactions and use the recorded data to visualise the sequence of user activities. 

This approach allows analysis sessions to be interpreted and understood by both humans and machines, making them comparable and suitable for various applications.

The figure below shows in a graphical interface a recorded sequence of interactions. The lanes show different sources of interactions like the visualisations used for analysis or the comment box to annotate insights. Between a start and end circle, the rectangles called Task show that different filters have applied to the data to manipulate the representation. To gain further insight into the analysis, a user can click on the rectangles to see what the visual representation in the dashboard looked like at the time of recording.

Figure 1: Graphical representation of an analysis session with interactions recorded in different visualisations interpretable by both humans and machines

With that approach, a user can recap the interactions that lead to an analysis result, share it or use it to improve processes where necessary. If analytical provenance is thought of even further, recommendations for handling can be derived from it and clustered for specific attacks. With that, a SOC can compare their analysis sessions and use them to a shared knowledge base in malware analysis.

2nd Joint Workshop – Dynamic Countering of Cyber-attacks | Achievements and Standardisation

After the results of first edition of the workshop back in 2021 was successful, SAPPAN will participate in the 2nd Joint Workshop–Dynamic countering of cyber-attacks, , organised by the CyberSANE projectand this time supported by the FIWARE FoundationThe participating projects are: SAPPANSOCCRATESC4IIoTCARAMELGUARD,  and SIMARGL

The workshop aims to gather the projects from the SU-ICT-01-2018 H2020 call, whose main topic is Dynamic countering of cyber-attacks, to share the main progress of the project, create synergies and set a common ground for standardisation activities, with guest speakers from Concordia project, ENISA, and StandICTMoreover, experts representing each project will discuss the different approaches to the common problem of attack detection and situational awareness in different environments.The workshop will be held online between 9:00 and 16:00CET on the February 8th 2022.

More information about the event can be found on the registration page. 

Attending this event is free of charge, however, registration is required.


Challenges in Visualization for AI

By Franziska Becker (University of Stuttgart, Institute for Visualization and Interactive Systems)
Artificial intelligence (AI) is one of the buzzwords that defined many conversations in the last 5-10 years. Especially in regards to technology, “Can we use AI to improve our product?” is not an uncommon question. With these conversations come issues concerning interpretability and explainability of AI models. Visualization can offer one way of approaching these topics, but also introduces new challenges, like effects of and on cognitive biases.

AI harnesses the power of machine learning to perform tasks more efficiently, more accurately or on a bigger scale than people are capable of doing. In chess, AI outperforms masters in terms of speed and skill. Even a supposedly simple task such as online search includes AI, since it can deal with the massive amounts of data that exist on the web. AI models can exhibit different degrees of interpretability, depending on the architecture and data employed. However, in general, more interpretability comes with lower accuracy: the interpretability-accuracy trade-off.

Figure 1: The interpretability-accuracy trade-off showing that models’ accuracy decreases as their interpretability increases, figure taken from Duttaroy [1].

This means that with an increasing desire to integrate high-performance AI in existing systems, interpretability of these models also gains in importance. Visualizations for AI interpretability aim to meet a multitude of goals. They may provide support for model debugging, help users compare and choose between different models or give some kind of explanation for a specific model output. Visualizations can give a detailed and interactive performance analysis, show patterns in model behaviour (see Figure 2) or display outputs from XAI methods like feature visualization or saliency maps.

Figure 2: Example visualizations from a SAPPAN prototype for a DGA classifier showing a 2D projection of activations (left) that are clustered using HDBSCAN, and a decision tree (right) that gives a local explanation for these clusters.

From the visualization point of view, we need not only consider perceptual mechanisms and rules for good visual encoding that answer our questions, but also how our presentation (including order, emphasis, etc.) and choice of what to visualize affects the viewer’s decision-making process. Research from cognitive psychology (e.g. in Caverni’s book [2]) has shown that people often employ an ever-growing number of cognitive biases. These biases can be characterized as a deviation from the ‘regular’ or ‘rational’ judgement process, though they do not necessarily have to lead to bad judgements. One example for a widely known cognitive bias is anchoring, which describes the (undue) influence an initial anchor has on a final judgement. Nourani et al. [3] have recently shown that users of a system can exhibit such behaviour when asked to judge model outputs. If participants started with cases where the model had obvious weaknesses, they were much more likely to distrust the model, even in cases where the model generally performed well. This can be seen as an example reducing automation bias (trusting automated systems too much) but increasing anchoring bias. Participants significantly underestimated model accuracy when starting with the model weaknesses, but had generally higher task accuracy, so they made less mistakes by relying on the model too much.

Wang et al. [4] suggest that anchoring bias in can be mitigated by showing input attributions for multiple outcomes or providing counterfactual explanations. Interestingly, whether participants were also given an explanation for model outputs did not have a significant effect on task accuracy in Nourani’s study [3]. Whether this is an indicator that the chosen type of explanation does not fit the given task well or that other factors were at fault is an opportunity for further research. In SAPPAN, we are currently conducting a study to see how differences in expertise affect appropriate trust and decision accuracy when using our visualization for DGA (domain generation algorithm) classifiers.

AI will undoubtedly play an integral part in our future. While interpretability is not essential in all areas, if we want to adopt AI techniques more widely and for critical sectors, it is people that need to understand its capabilities and limitations. Consequently, we must consider what visualizations ought to do and how different designs can achieve their goals for specific users. Which biases affect us most when we have to make decisions based on machine outputs and how can systems mitigate these biases? To that end, it is also necessary to further improve our methods of extracting users’ mental models so that we can study the interactions between design and the decision-making process.

References

[1]

A. Duttaroy, „3 X’s of Explainable AI,“ 2021. [Online]. Available: https://www.lntinfotech.com/wp-content/uploads/2021/01/3xExplainable-AI.pdf. [Access: 14 December 2021].

[2]

J.-P. Caverni, J.-M. Fabre und M. Gonzalez, Cognitive biases, Elsevier, 1990.

[3]

M. Nourani et al. „Investigating the Importance of First Impressions and Explainable AI with Interactive Video Analysis“ in CHI EA ’20: Extended Abstracts of the 2020 CHI Conference on Human Factors in Computing Systems. 2020.

[4]

D. Wang, Q. Yang, A. Abdul und B. Y. Lim. „Designing Theory-Driven User-Centric Explainable AI“ in Proceedings of the 2019 CHI conference on human factors in computing systems. 2019.

About the author(s): Franziska Becker studied cognitive science and computer science at the University of Osnabrück and is currently a researcher at the Visualization Institute (VIS) at the University of Stuttgart. Her work concerns visualization for AI and the human factors involved in designing such visualization systems.

Slush 2021

SAPPAN was presented with Project BLACKFIN at ECSO organised “Cyber Investor Days”, Slush 2021 🙂

Read more here.

HPE WiS group (Women in Security) Webinar

This webinar is organised by the CodePlus project. This project is organised by the National University of Ireland Galway (NUIG), Dublin City University (DCU) and the University of Limerick (UL) with the following goals:

  • Offer purposefully designed coding workshops (20 hours in duration) to cohorts of female students. The workshops used a collaborative approach to teaching & learning which has proved effective in helping learners engage with CS and more general 21st-century skills. Due to COVID-19 restrictions, both face-to-face and online modes of delivery were available.
  • Collaborate with tech companies to organise interactive webinars for students to engage with female IT professionals.
  • Work with tech companies to organise visits, for students, to company offices for tours and talks with female IT professionals (subject to COVID restrictions).

On December 9, 2021, there was a Webinar presented by the Women in Security (WiS) group at HPE for secondary school girls. Gabriela Aumayr (HPE/SAPPAN) talked about her professional paths toward Computer Science careers, including her involvement with the SAPPAN project.

The event saw attendance from about 200 secondary school girls from the west coast of Ireland. The talks were very well received, and the organisers suggested there might be a similar event with new schools next year (2022).